Bitcoin's Pivotal $80,000 Reclaim: A Deep Dive into What's Next for BTC
The cryptocurrency market is buzzing with renewed optimism as Bitcoin, the undisputed leader of digital assets, has decisively reclaimed the significant $80,000 threshold. As the first full week of May unfolds, BTC's persistent trading above this pivotal psychological and technical level marks a critical juncture for its price trajectory. This move follows a period of intense consolidation and volatility, signaling a potentially transformative phase for the market. Our senior analysis delves into the underlying factors, technical indicators, and on-chain dynamics that could dictate Bitcoin's next major move.
Reclaiming Key Technical Milestones: $80K and the 100-Day Moving Average
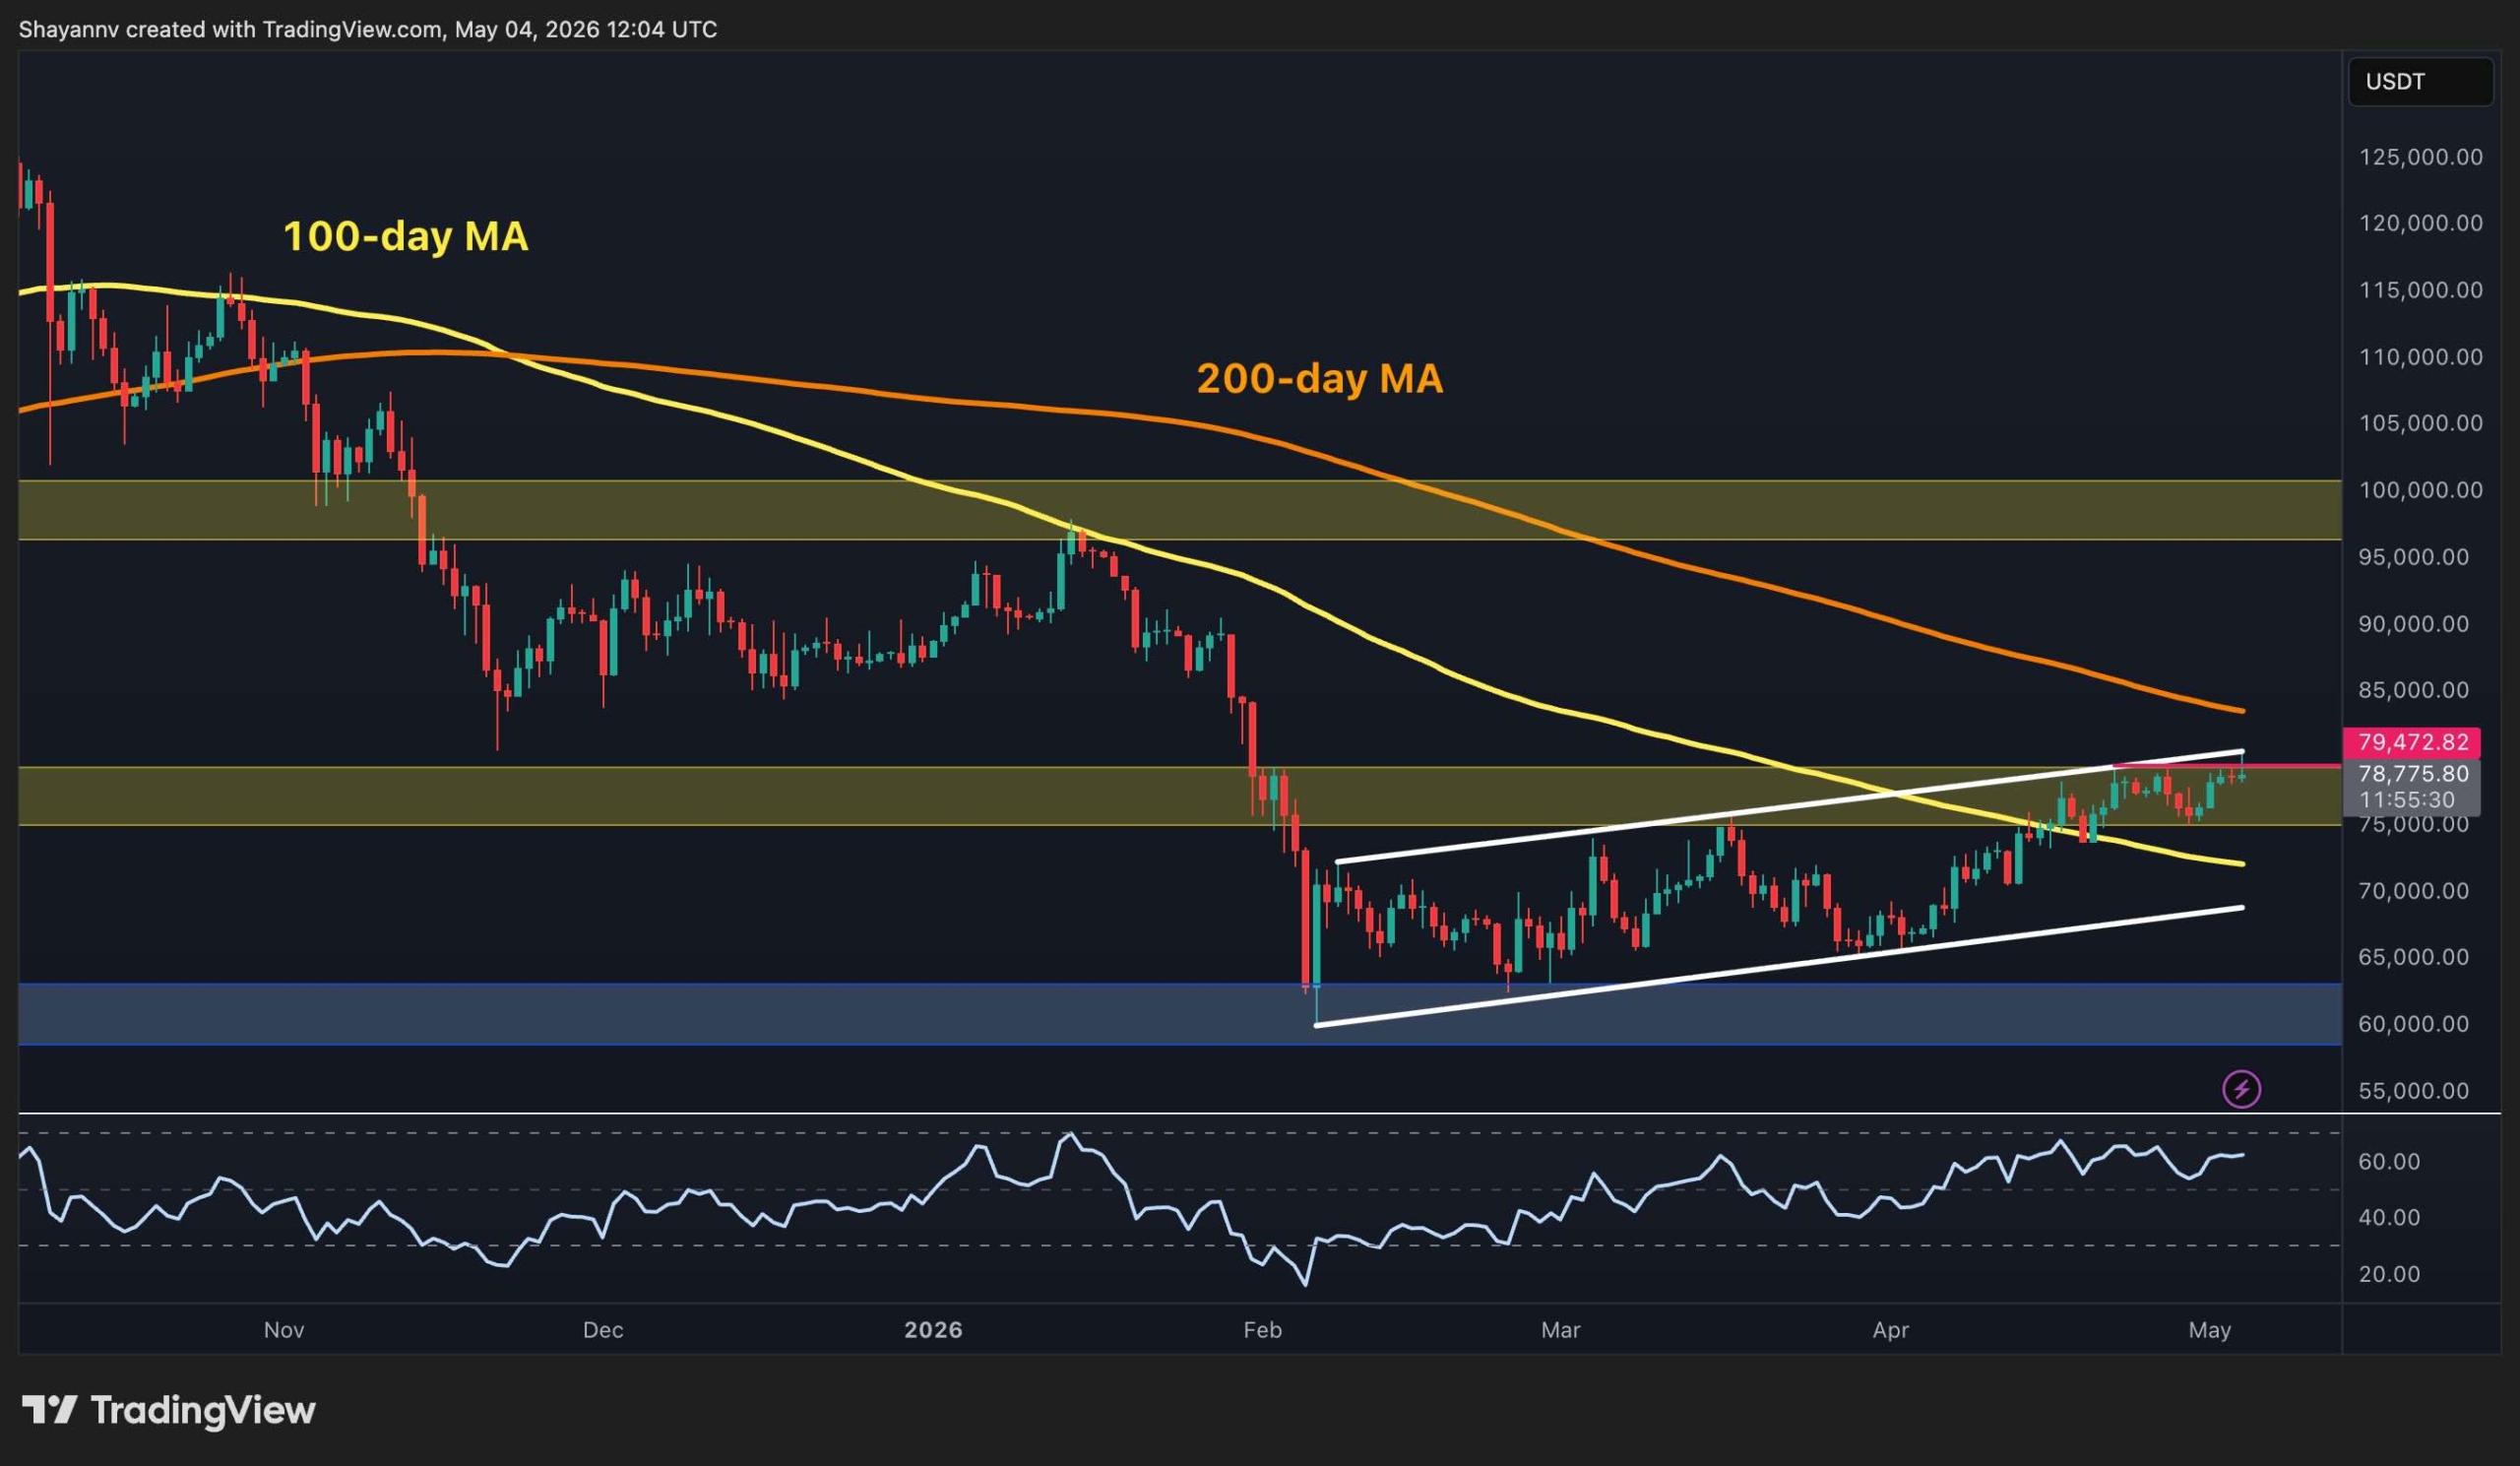
Bitcoin's ability to not only touch but sustain price action above $80,000 is more than just a psychological victory; it's a technical statement. This level has historically acted as both strong support and formidable resistance, and its reclaim suggests a significant shift in market sentiment and underlying strength. Historically, decisive breaks and successful retests of such major resistance levels often precede robust uptrends.
Perhaps even more indicative of this bullish shift is the clear reclamation of the 100-day moving average (MA). This widely respected indicator of medium-term trend direction provides a clearer picture of Bitcoin's momentum. Trading below the 100-day MA often signals bearish pressure or consolidation, while a sustained move above it, as we are now witnessing, indicates a decisive shift towards a more optimistic trajectory. This technical confluence – the $80,000 flip combined with the 100-day MA reclaim – paints the most constructive market structure we've seen since the previous cycle peak, underscoring a fundamental strengthening of Bitcoin's position.
The Formidable Supply Zone: Bitcoin's Ultimate Test
While the initial reclaim of $80,000 and the 100-day MA are undeniably bullish signals, Bitcoin now finds itself pressing firmly against the upper boundary of a formidable supply zone. This area, which has served as the defining ceiling of the recent recovery, represents a concentration of selling interest from previous price peaks or accumulation points. Overcoming such a significant supply zone is often the ultimate test for an asset attempting to establish a new uptrend.
A supply zone acts as a natural barrier where a large number of sellers are strategically positioned, eager to offload their holdings at what they perceive as favorable prices. This often leads to price rejection or prolonged consolidation within the zone. For Bitcoin to continue its ascent, a decisive breach of this overhead resistance, backed by substantial trading volume, will be crucial. A clean daily and weekly close above this zone would confirm a powerful breakout, potentially invalidating months of overhead pressure and paving the way for further upside. Conversely, a prolonged rejection could lead to a retest of newly established support levels, turning $80,000 into a key battleground.
On-Chain Insights: The Invisible Hand of Accumulation
Beyond the visible price charts, on-chain data provides invaluable insights into the behavior of market participants and the underlying health of the network. The current constructive market structure is heavily supported by several bullish on-chain metrics.
Accumulation Trends: Recent data suggests a robust accumulation phase by long-term holders (LTHs) and even some whale entities. These 'smart money' investors are moving coins off exchanges into cold storage, indicating a strong conviction in Bitcoin's long-term value rather than an intent to sell in the short term. This reduces the readily available supply on exchanges.
Exchange Reserves: We've observed a continued decline in Bitcoin exchange reserves. This trend signifies that fewer BTC are held on centralized exchanges, diminishing immediate selling pressure and implying that investors prefer to 'HODL' their assets rather than keep them liquid for trading. Lower supply on exchanges against rising demand is a classic recipe for price appreciation.
Network Activity: Metrics such as transaction counts and active addresses have shown healthy growth, pointing to increasing utility and adoption of the Bitcoin network. Furthermore, indicators like the Spent Output Profit Ratio (SOPR) returning to healthy levels suggest that overall market participants are selling into profit, which is sustainable, unlike capitulation selling.
These on-chain signals collectively paint a picture of underlying strength and conviction, suggesting that the recent price action is not merely speculative but driven by fundamental accumulation.
Macroeconomic Influences and Future Scenarios
While Bitcoin often exhibits a degree of independence, it is not entirely immune to the broader macroeconomic climate. Global liquidity, inflation concerns, and central bank policies continue to shape investor sentiment across all risk assets. Any dovish shifts from major central banks or a clearer path towards interest rate cuts could provide additional tailwinds for Bitcoin, amplifying its appeal as a scarce, hard asset in an inflationary environment.
Considering the confluence of technical and on-chain signals, several scenarios could unfold:
The Bullish Breakout: If Bitcoin successfully breaks and sustains above the current supply zone with significant volume, the path could clear for an accelerated move. Immediate targets could lie at $85,000, followed by the psychological $90,000, and potentially a rapid ascent towards the coveted $100,000 mark or even new all-time highs. This scenario would be fueled by continued institutional adoption, ETF inflows (if applicable), and a favorable macroeconomic backdrop.
Consolidation and Retest: Should the supply zone prove too formidable in the short term, a period of healthy consolidation around the $80,000 level or a retest of newly established supports (e.g., $75,000 or the 100-day MA) is plausible. This would allow the market to digest recent gains, build a stronger base, and gather momentum for a subsequent breakout attempt. Such a retest would not necessarily negate the bullish outlook but rather represent a temporary pause.
Bearish Rejection: While less likely given the current constructive structure, a significant and sustained rejection from this resistance, coupled with a break below key support levels, would signal a temporary capitulation. However, the strong underlying accumulation and reclaimed technical levels suggest this is a lower probability outcome at this juncture.
Conclusion: A Cautiously Optimistic Outlook
Bitcoin's current position above $80,000 and the clear reclamation of its 100-day moving average paint a cautiously optimistic picture for the world's largest cryptocurrency. The underlying market structure is undeniably strong, bolstered by robust on-chain accumulation trends that suggest smart money is positioning for further upside. However, the immediate challenge lies in decisively breaking above the formidable supply zone that has capped previous recovery attempts.
The coming weeks will be crucial in determining Bitcoin's near-term trajectory. A sustained breakout above current resistance could ignite a powerful rally towards new price discovery, while a period of consolidation would allow for a healthy re-accumulation phase. For investors, this period calls for vigilance, strategic positioning, and a close eye on both technical indicators and the evolving on-chain narrative. The stage is set for what could be one of Bitcoin's most significant moves in this cycle.